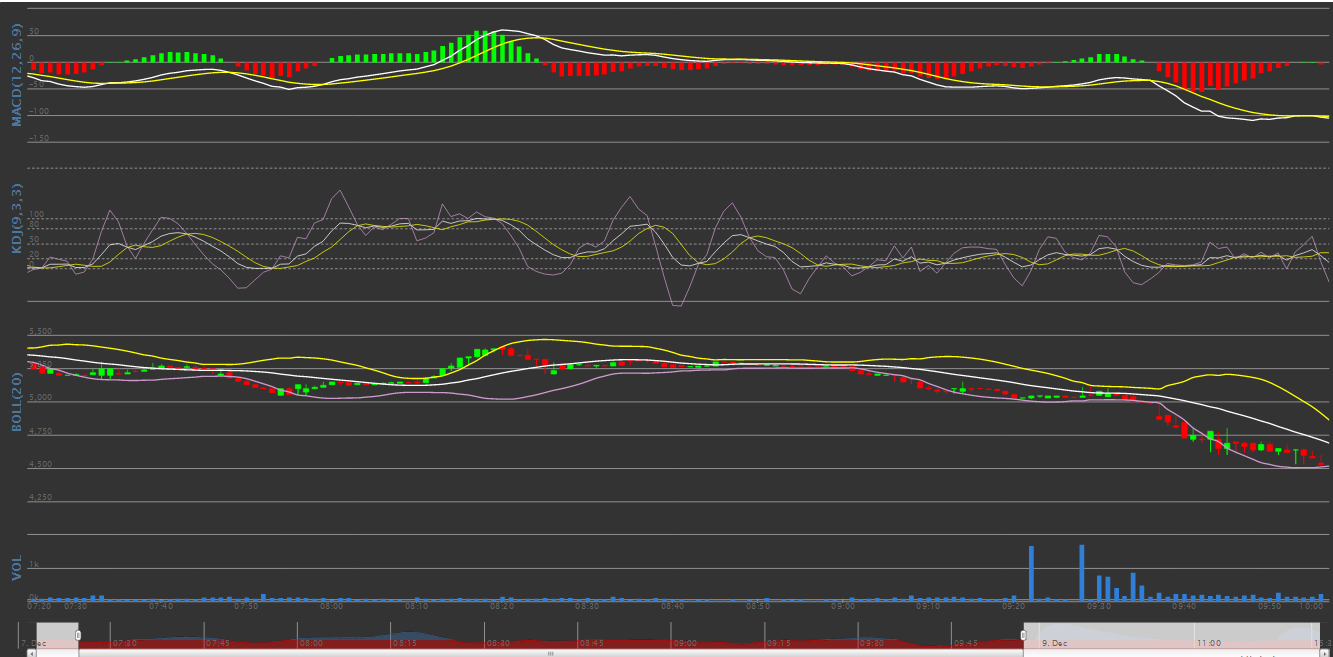
比特币是最近相当火爆的一个金融衍生品(瞧咱这口径)。比特币中国提供了一系列 API 来获取和操纵其市场内的比特币。我的小伙伴们基于其 API,完成了一套交易程序。为了提高操作的有效性和技术性,同时作为 python 学习需要,我也参与进来,仿造股票交易软件,为比特币中国绘制了一系列指标图,包括 MACD、BOLL、KDJ 等。截止上周,btc123 也开始提供了 MACD 指标图,所以把自己的实现贴到博客。
首先是获取数据,比特币中国的 API 是个很鬼怪的东西,实时交易数据的接口,返回的数据中最高最低和成交量都是基于过去24小时的,要知道比特币交易是没有休市的啊。所以获取数据过程中需要自己计算这些。这里考虑到股市一般一天实际交易4小时,所以整个设计也是默认4小时的图形展示。
#!/usr/bin/env python3
# -*- coding: utf-8 -*-
# query price data from BTCChina.
from urllib import urlopen
from ast import literal_eval
import MySQLdb
import json
import yaml
import time

config = yaml.load(open('config.yaml'))
conn = MySQLdb.connect(host=config['database']['host'],user=config['database']['username'],passwd=config['database']['password'],db =config['database']['databasename'],charset=config['database']['encoding'] )

def write_db(datas):
    try:
        cur_write = conn.cursor()
        sql =  "insert into ticker(sell, buy, last, vol, high, low) values( %s, %s, %s,%s,%s,%s)"
        cur_write.execute(sql,datas)
        conn.commit()
        cur_write.close()
    except MySQLdb.Error,e:
        print "Mysql error %d : %s." % (e.args[0], e.args[1])

def get_tid():
    try:
        vol_url = config['btcchina']['vol_url']
        remote_file = urlopen(vol_url)
        remote_data = remote_file.read()
        remote_file.close()
        remote_data = json.loads(str(remote_data))
        return remote_data[-1]['tid']
    except MySQLdb.Error,e:
        print "Mysql error %d : %s." % (e.args[0], e.args[1])

def get_ohlc(num):
    try:
        read = conn.cursor()
        hlvsql = "select max(last),min(last) from ticker where time between date_add(now(),interval -%s minute) and now()" % num
        read.execute(hlvsql)
        high, low = read.fetchone()
        closesql = "select last from ticker where time between date_add(now(),interval -%s minute) and now() order by time desc limit 1" % num
        read.execute(closesql)
        close = read.fetchone()
        opensql = "select last from ticker where time between date_add(now(),interval -%s minute) and now() order by time asc limit 1" % num
        read.execute(opensql)
        opend = read.fetchone()
        return opend[0], high, low, close[0]
    except MySQLdb.Error,e:
        print "Mysql error %d : %s." % (e.args[0], e.args[1])

def write_ohlc(data):
    try:
        cur_write = conn.cursor()
        ohlcsql =  'insert into ohlc(open, high, low, close, vol) values( %s, %s, %s, %s, %s)'
        cur_write.execute(ohlcsql, data)
        conn.commit()
        cur_write.close()
    except MySQLdb.Error,e:
        print "Mysql error %d : %s." % (e.args[0], e.args[1])
    except Exception as e:
        print("执行Mysql写入数据时出错: %s" %  e)

def instance():
    try:
    # returns something like {"high":738.88,"low":689.10,"buy":713.50,"sell":717.30,"last":717.41,"vol":4797.32000000}
        remote_file = urlopen(config['btcchina']['ticker_url'])
        remote_data = remote_file.read()
        remote_file.close()
        remote_data = json.loads(str(remote_data))['ticker']
    #   remote_data = {key:literal_eval(remote_data[key]) for key in remote_data}
    except:
        remote_data = []
    datas = []
    for key in remote_data:
        datas.append(remote_data[key])
    return datas

lastid = 0
ohlc_period = 60
next_ohlc = int(time.time()) / ohlc_period * ohlc_period
while True:
    datas = instance()
    if datas:
        write_db(datas)
    if(int(time.time()) > next_ohlc):
        next_ohlc += ohlc_period

        data = list(get_ohlc(1))

        latestid = get_tid()
        data.append(int(latestid) - int(lastid))
        lastid = latestid

        write_ohlc(data)
        time.sleep(1)
这里主要把实时数据存入ticker表,分钟统计数据存入ohlc表。然后是各指标算法。首先是 MACD :
#/*******************************************************************************
# * Author: Chenlin Rao | Renren inc.
# * Email: rao.chenlin@gmail.com
# * Last modified: 2013-11-26 22:02
# * Filename: macd.py
# * Description:
#       EMA(12)=LastEMA(12)* 11/13 + Close * 2/13
#       EMA(26)=LastEMA(26)* 25/27 + Close * 2/27
#
#       DIF=EMA(12)-EMA(26)
#       DEA=LastDEA * 8/10 + DIF * 2/10
#       MACD=(DIF-DEA) * 2
# * *****************************************************************************/
#!/usr/bin/env python
# -*- coding: utf-8 -*-

import time
import hashlib
import MySQLdb
import yaml

class MACD():

    def __init__(self):
        config = yaml.load(open('config.yml'))
        self.sleep_time = config['btcchina']['trade_option']['sleep_time']
        self.conn = MySQLdb.connect(host=config['database']['host'],user=config['database']['username'],passwd=config['database']['password'],db =config['database']['databasename'],charset=config['database']['encoding'] )

    def _getclose(self, num):
        read = self.conn.cursor()
        sql = "select close,time from ohlc order by id desc limit %s" % num
        count = read.execute(sql)
        results = read.fetchall()
        return results[::-1]

    def _ema(self, s, n):
        """
        returns an n period exponential moving average for
        the time series s

        s is a list ordered from oldest (index 0) to most
        recent (index -1)
        n is an integer

        returns a numeric array of the exponential
        moving average
        """
        if len(s) <= n:
            return "No enough item in %s" % s
        ema = []
        j = 1

        #get n sma first and calculate the next n period ema
        sma = sum(s[:n]) / n
        multiplier = 2 / float(1 + n)
        ema.append(sma)

        #EMA(current) = ( (Price(current) - EMA(prev) ) x Multiplier) + EMA(prev)
        ema.append(( (s[n] - sma) * multiplier) + sma)

        #now calculate the rest of the values
        for i in s[n+1:]:
            tmp = ( (i - ema[j]) * multiplier) + ema[j]
            j = j + 1
            ema.append(tmp)

        return ema

    def getMACD(self, n):
        array = self._getclose(n)
        prices = map(lambda x: x[0], array)
        t = map(lambda x: int(time.mktime(x[1].timetuple())) * 1000, array)

        short_ema = self._ema(prices, 12)
        long_ema = self._ema(prices, 26)
        diff = map(lambda x: x[0]-x[1], zip(short_ema[::-1], long_ema[::-1]))
        diff.reverse()

        dea = self._ema(diff, 9)

        bar = map(lambda x: 2*(x[0]-x[1]), zip(diff[::-1], dea[::-1]))
        bar.reverse()

        return zip(t[33:], diff[8:]), zip(t[33:], dea), zip(t[33:], bar)
然后是 BOLL :
#/*******************************************************************************
# * Author: Chenlin Rao | Renren inc.
# * Email: rao.chenlin@gmail.com
# * Last modified: 2013-11-26 22:02
# * Filename: macd.py
# * Description:
#       MA=avg(close(20))
#       MD=std(close(20))
#
#       MB=MA(20)
#       UP=MB + 2*MD
#       DN=MB - 2*MD
# * *****************************************************************************/
#!/usr/bin/env python
# -*- coding: utf-8 -*-
import random
import hashlib
import MySQLdb
import yaml
import time

class BOLL():

    def __init__(self):
        config = yaml.load(open('config.yml'))
        self.sleep_time = config['btcchina']['trade_option']['sleep_time']
        self.conn = MySQLdb.connect(host=config['database']['host'],user=config['database']['username'],passwd=config['database']['password'],db =config['database']['databasename'],charset=config['database']['encoding'] )

    def _getMA(self, array):
        length = len(array)
        return sum(array) / length

    def _getMD(self, array):
        length = len(array)
        average = sum(array) / length
        d = 0
        for i in array: d += (i - average) ** 2
        return (d/length) ** 0.5

    def getOHLC(self, num):
        read = self.conn.cursor()
        sql = "select time,open,high,low,close,vol from ohlc order by id desc limit %s" % num
        count = read.execute(sql)
        results = read.fetchall()
        return map(lambda x: [int(time.mktime(x[0].timetuple())) * 1000, x[1],x[2],x[3],x[4],x[5]], results[::-1])

    def _getCur(self, fromtime):
        curread = self.conn.cursor()
        cursql = "select last,vol from ticker where time between date_add('%s', interval -0 minute) and now()" % time.strftime('%F %T', time.localtime(fromtime))
        curread.execute(cursql)
        curlist = map(lambda x: x[0], curread.fetchall())
        vollist = map(lambda x: x[1], curread.fetchall())
        if len(curlist) > 0:
            return int(time.time())*1000, curlist[0], max(curlist), min(curlist), curlist[-1], sum(vollist)
        else:
            return None

    def _getClose(self, matrix):
        close = map(lambda x: x[4], matrix)
        return close

    def getBOLL(self, num, days):
        matrix = self.getOHLC(num)
        cur = self._getCur(matrix[-1][0]/1000)
        if cur:
            matrix.append(cur)
        array = self._getClose(matrix)
        up = []
        mb = []
        dn = []

        x = days
        while x < len(array):
            curmb = self._getMA(array[x-days:x])
            curmd = self._getMD(array[x-days:x])
            mb.append( [ matrix[x][0], curmb ] )
            up.append( [ matrix[x][0], curmb + 2 * curmd ] )
            dn.append( [ matrix[x][0], curmb - 2 * curmd ] )
            x += 1

        return matrix[days:], up, mb, dn
最后是 KDJ :
#/*******************************************************************************
# * Author: Chenlin Rao | Renren inc.
# * Email: rao.chenlin@gmail.com
# * Last modified: 2013-11-26 22:02
# * Filename: macd.py
# * Description:
#       RSV=(close-low(9))/(high(9)-low(9))*100
#       K=SMA(RSV(3), 1)
#       D=SMA(K(3), 1)
#       J=3*K-2*D
# * *****************************************************************************/
#!/usr/bin/env python
# -*- coding: utf-8 -*-
import hashlib
import MySQLdb
import yaml
import time

class KDJ():

    def __init__(self):
        config = yaml.load(open('config.yml'))
        self.sleep_time = config['btcchina']['trade_option']['sleep_time']
        self.conn = MySQLdb.connect(host=config['database']['host'],user=config['database']['username'],passwd=config['database']['password'],db =config['database']['databasename'],charset=config['database']['encoding'] )

    def _getHLC(self, num):
        read = self.conn.cursor()
        sql = "select high,low,close,time from ohlc order by id desc limit %s" % num
        count = read.execute(sql)
        results = read.fetchall()
        return results[::-1]

    def _avg(self, a):
        length = len(a)
        return sum(a) / length

    def _getMA(self, values, window):
        array = []
        x = window
        while x < len(values):
            curmb = self._avg(values[x-window:x])
            array.append( curmb )
            x += 1
        return array

    def _getRSV(self, arrays):
        rsv = []
        times = []
        x = 9
        while x < len(arrays):
            high = max(map(lambda x: x[0], arrays[x-9:x]))
            low = min(map(lambda x: x[1], arrays[x-9:x]))
            close = arrays[x-1][2]
            rsv.append( (close-low)/(high-low)*100 )
            t = int(time.mktime(arrays[x-1][3].timetuple())) * 1000
            times.append(t)
            x += 1
        return times, rsv

    def getKDJ(self, num):
        hlc = self._getHLC(num)
        t, rsv = self._getRSV(hlc)
        k = self._getMA(rsv,3)
        d = self._getMA(k,3)
        j = map(lambda x: 3*x[0]-2*x[1], zip(k[3:], d))
        return zip(t[2:], k), zip(t[5:], d), zip(t[5:], j)
最后通过一个简单的python web框架完成界面展示,这个叫 bottle.py 的框架是个单文件,相当方便。
#!/usr/bin/python
import json
import yaml
from macd import MACD
from boll import BOLL
from kdj import KDJ
from bottle import route, run, static_file, redirect, template

config = yaml.load(open('config.yml'))
color = {
    'cn':{'up':'#ff0000','dn':'#00ff00'},
    'us':{'dn':'#ff0000','up':'#00ff00'},
}

@route('/')
def index():
    redirect('/mkb/240')

@route('/mkb/<ago:int>')
def mkb(ago):
    like = config['webui']['color']
    return template('webui', ago = ago, color = color[like])

@route('/js/<filename>')
def js(filename):
    return static_file(filename, root='./js/')

@route('/boll')
def boll():
    return "boll"

@route('/macd/<day:int>')
def macd(day):
    m = MACD()
    dif, dea, bar = m.getMACD(day)
    return json.dumps({'dif':dif, 'dea':dea, 'bar':bar})

@route('/boll/<day:int>')
def boll(day):
    b = BOLL()
    ohlc, up, md, dn = b.getBOLL(day, 20)
    return json.dumps({'ohlc':ohlc, 'up':up, 'md':md, 'dn':dn})

@route('/kdj/<day:int>')
def kdj(day):
    kdj = KDJ()
    k, d, j = kdj.getKDJ(day)
    return json.dumps({'k':k, 'd':d, 'j':j})

run(host='127.0.0.1', port=8000, debug=True)
唯一的一个 html 就是具体用 highcharts 画图的地方,如下:
<html>
<head>
   <meta http-equiv="refresh" content="60">
   <script type="text/javascript" src="http://ajax.googleapis.com/ajax/libs/jquery/1.8.2/jquery.min.js"></script>
   <script type="text/javascript" src="/js/highstock.js"></script>
   <script type="text/javascript" src="/js/highcharts.js"></script>
   <script>
    $(function () {
        Highcharts.setOptions({
            global: {
                useUTC: false
            }
        });
        $.getJSON('/boll/', function(bolldata) {
            var ohlc = []
                volume = [],
                dataLength = bolldata['ohlc'].length;
            for (i = 0; i < dataLength; i++) {
                ohlc.push([
                    bolldata['ohlc'][i][0],
                    bolldata['ohlc'][i][1],
                    bolldata['ohlc'][i][2],
                    bolldata['ohlc'][i][3],
                    bolldata['ohlc'][i][4],
                ]);
                volume.push([
                    bolldata['ohlc'][i][0],
                    bolldata['ohlc'][i][5],
                ])
            };
            $.getJSON('/kdj/', function(kdjdata) {
               $.getJSON('/macd/', function(macddata) {
                    $('#container').highcharts('StockChart', {
                        rangeSelector: {
                            enabled: 0
                        },
                        chart: {
                            backgroundColor: '#333333',
                        },
                	    tooltip: {
                	    	formatter: function() {
                				var s = '<b>'+ Highcharts.dateFormat('%A, %b %e, %H:%M', this.x) +'</b>';
                				$.each(this.points, function(i, point) {
                					s += '<br/>'+this.series.name+': '+parseFloat(point.y).toFixed(2);
                				});
                				return s;
                			}
                	    },
                        plotOptions: {
                            series: {
                                marker: {
                                    enabled: false
                                },
                                lineWidth: 1.1,
                            }
                        },
                        yAxis: [{
                          title: {
                              text: 'MACD(12,26,9)'
                          },
                          height: 200,
                        }, {
                          title: {
                              text: 'KDJ(9,3,3)'
                          },
                          top: 250,
                          height: 150,
                          offset: 0,
                          gridLineDashStyle: 'Dash',
                          tickPositions: [0, 20, 50, 80, 100, 200]
                        }, {
                            title: {
                                text: 'BOLL(20)'
                            },
                            top: 450,
                            height: 300,
                            offset: 0,
                        }, {
                            title: {
                                text: 'VOL'
                            },
                            top: 800,
                            height: 100,
                            offset: 0,
                        }],
                        series: [{
                            name: 'BAR',
                            color: '',
                            negativeColor: '',
                            borderColor: '#333333',
                            type: 'column',
                            data: macddata['bar'],
                            yAxis: 0,
                        }, {
                            name: 'DIFF',
                            color: '#ffffff',
                            type: 'line',
                            data: macddata['dif'],
                            lineWidth: 2,
                            yAxis: 0,
                        }, {
                            name: 'DEA',
                            color: '#ffff00',
                            type: 'line',
                            data: macddata['dea'],
                            lineWidth: 2,
                            yAxis: 0,
                        }, {
                            name: 'K',
                            color: '#ffffff',
                            type: 'line',
                            data: kdjdata['k'],
                            yAxis: 1,
                        }, {
                            name: 'D',
                            color: '#ffff00',
                            type: 'line',
                            data: kdjdata['d'],
                            yAxis: 1,
                        }, {
                            name: 'J',
                            color: '#cc99cc',
                            type: 'line',
                            data: kdjdata['j'],
                            yAxis: 1,
                        }, {
                            type: 'candlestick',
                            name: 'ohlc',
                            data: ohlc,
                            upColor: '',
                            upLineColor: '',
                            color: '',
                            lineColor: '',
                            yAxis: 2,
                        }, {
                            type: 'spline',
                            name: 'up',
                            data: bolldata['up'],
                            color: '#ffff00',
                            lineWidth: 2,
                            yAxis: 2,
                        }, {
                            type: 'spline',
                            name: 'md',
                            data: bolldata['md'],
                            color: '#ffffff',
                            lineWidth: 2,
                            yAxis: 2,
                        }, {
                            type: 'spline',
                            name: 'dn',
                            data: bolldata['dn'],
                            color: '#cc99cc',
                            lineWidth: 2,
                            yAxis: 2,
                        }, {
                            name: 'VOL',
                            borderColor: '#333333',
                            type: 'column',
                            data: volume,
                            yAxis: 3,
                        }]
                    });
                });
            });
        });
    });
   </script>
</head>
<body>
   <div id="container" style="min-width:800px;height:1000px;"></div>
</body>
</html>
highcharts 有个问题,就是不能跟 amcharts 或者 echarts 那样提供一个画笔工具,让用户自己在生成的图形上再涂抹线条,这个功能其实在蜡烛图上判断压力位支撑位的时候很有用。不过蜡烛图 btc123 也提供了,我也就懒得再用 amcharts 重写一遍。
效果如下: